Bullish Candlestick Patterns PDF Free Download, Bullish candlestick patterns with examples, Bullish candlestick patterns explained
If you want to make daily profit by trading candlestick patterns then this article is for you. Because today we will give you a Bullish Candlestick Patterns PDF cheat sheet for free download.
As you know– There are two types of candlestick chart patterns first are bullish 📈 and second are bearish 📉
If A stock or index like Nifty or Banknifty goes up then we use mostly bullish candlestick pattern.
And same way, when market goes down then we have to use bearish Candlestick patterns.
Today we will talk about 10 types of Bullish Candlestick Chart Patterns in details and you can also download this Bullish Candlestick Patterns PDF for Free.
Here are the details of this bullish candlestick patterns pdf–
PDF Name
Bullish Candlestick Patterns With Example
Language
English
Format
PDF
Pages
17
Ratings
4.9/5
Author
Deepak Sen
Total patterns
10
PDF Size
3 MB
Download Link
Given Below
Bullish candlestick patterns Cheat Sheet PDF Free Download
Bullish candlestick patterns are chart patterns in stock trading that suggest a potential price increase. They indicate that the market sentiment is positive, and buyers are in control.
Examples include the “Hammer” and “Engulfing” patterns.
These patterns can be valuable for traders looking to buy or hold stocks.
Bullish candlestick patterns are important for identifying upward trends in stock markets, These patterns help traders in making profitable decisions.
All Bullish Candlestick Patterns PDF Download Free
Now let’s know about all bullish candlestick patterns with example one by one, The First Pattern is–
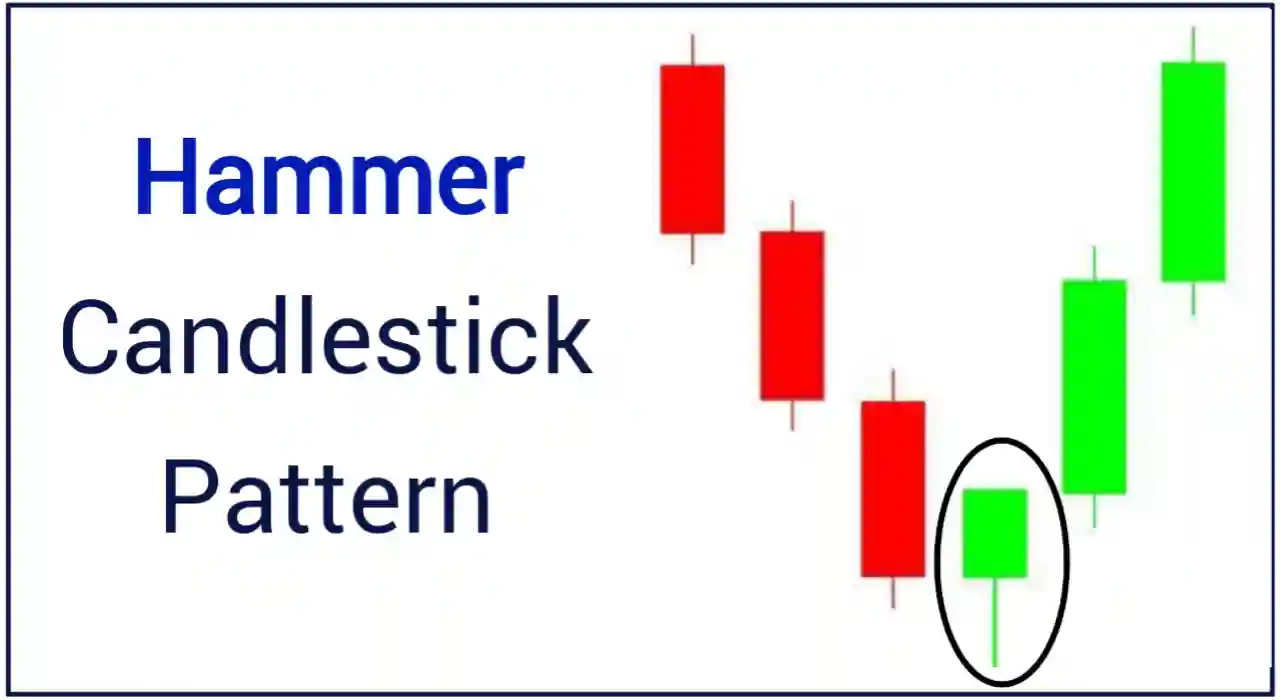
1. Hammer Candlestick Pattern
The “Hammer” is a bullish candlestick pattern that signals a potential trend reversal. It looks like a small candle with a short body and a long lower shadow, resembling a hammer.
The long lower shadow indicates that sellers pushed prices significantly lower, but buyers managed to bring them back up, closing near the high.
Example: Imagine a stock has been declining, but then you see a hammer candlestick form at the bottom of the downtrend.
This suggests that buyers are gaining control, and a potential price reversal may occur. Traders often use this pattern to enter long positions, betting on a price increase.
When trading the “Hammer” bullish candlestick pattern, here’s a basic strategy:
Entry: Enter a long (buy) position right after the hammer candlestick forms. This is a signal that potential upward momentum is building.
Stop Loss: Place a stop-loss order just below the low of the hammer candlestick. This protects you in case the reversal doesn’t happen, limiting potential losses.
Target: Set a profit target based on your risk-reward ratio. A common approach is to aim for a target that is at least twice the distance between your entry point and your stop loss.
Exit: Consider exiting the trade when the price reaches your predetermined target, or if you see signs of a trend reversal.
Now let’s move on to second bullish candlestick pattern which is–
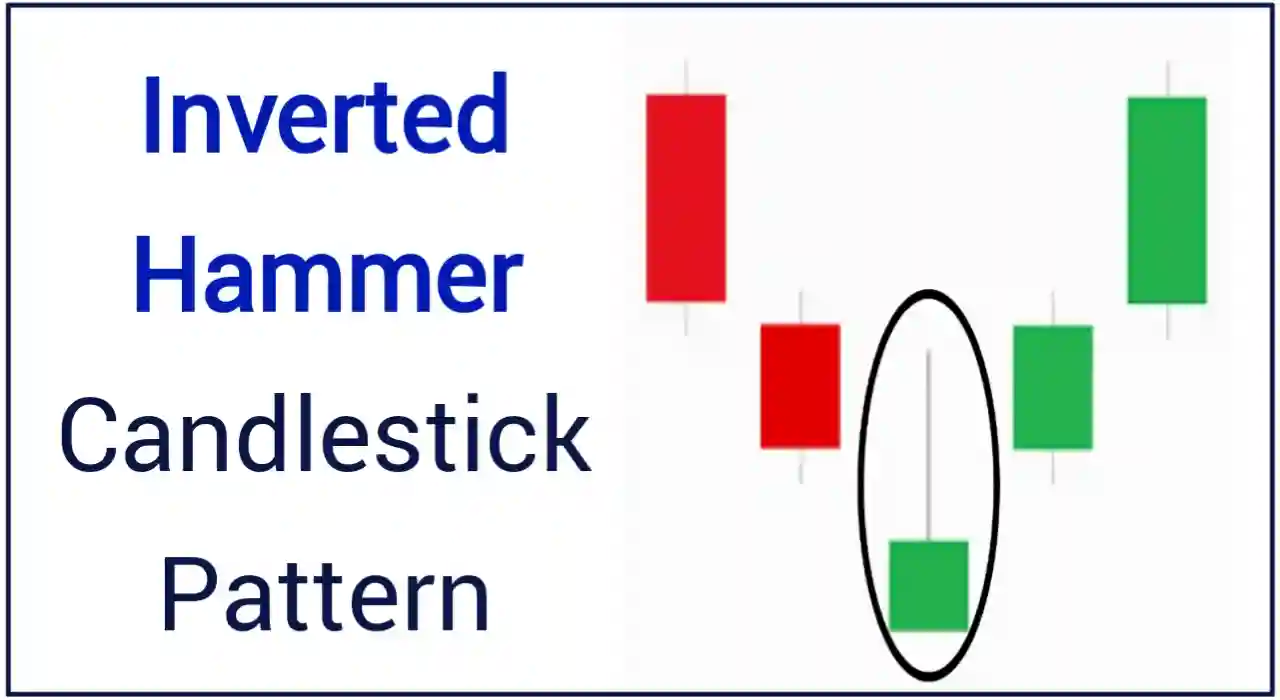
2. Inverted Hammer Candlestick Pattern
The “Inverted Hammer” is another bullish candlestick pattern that suggests a potential trend reversal, but it has a distinct appearance.
It looks like an upside-down hammer with a small body and a long upper shadow.
This pattern forms when the market opens lower, then rallies significantly higher during the trading session, and finally closes near the opening price.
The long upper shadow indicates that sellers tried to push prices down, but buyers stepped in and pushed them back up.
Example: Imagine a stock has been in a downtrend for some time. Then, you spot an inverted hammer candlestick at the bottom of this downtrend.
This pattern suggests that sellers attempted to drive prices down but failed, and buyers may be gaining control, potentially leading to a price reversal.
How to trade Inverted Hammer:
Entry: Go long (buy) when the inverted hammer candlestick forms. This signifies a potential bullish reversal. You can enter the trade at the open of the next candle or when you see confirmation of upward momentum.
Stop Loss: Place a stop-loss order just below the low of the inverted hammer candle. This helps protect your capital in case the reversal doesn’t materialize.
Target: Set a profit target, typically aiming for a risk-reward ratio of at least 1:2 or 1:3, where your potential reward is two to three times greater than your risk.
Exit: Exit the trade when the price reaches your predetermined target, or if you notice signs of a trend reversal or weakening bullish momentum.
Third bullish candlestick pattern is;
3. Bullish Engulfing Candlestick Pattern
The “Bullish Engulfing” is a powerful bullish candlestick pattern that indicates a potential reversal of a downtrend.
It occurs when a smaller bearish (downward) candle is followed by a larger bullish (upward) candle, with the second candle completely engulfing the first one.
This pattern suggests a shift in sentiment from bearish to bullish.
Example: Suppose you’re analyzing a stock chart, and you notice a small red (down) candle followed by a larger green (up) candle where the green candle’s body fully engulfs the red one.
This signals that buyers have overwhelmed the sellers and may lead to an upward price reversal.
How to trade Bullish Engulfing Pattern:
Entry: Enter a long (buy) position at the open of the candle following the bullish engulfing pattern. This confirms the bullish sentiment.
Stop Loss: Place a stop-loss order just below the low of the engulfing candle to protect your trade from potential losses if the reversal doesn’t materialize.
Target: Set a profit target based on your risk-reward ratio, aiming for a reward that is at least twice the size of your risk (stop loss).
Exit: Consider exiting the trade when the price reaches your predetermined target or if you see signs of a trend reversal or weakening bullish momentum.
Fourth Bullish Candlestick Pattern is;
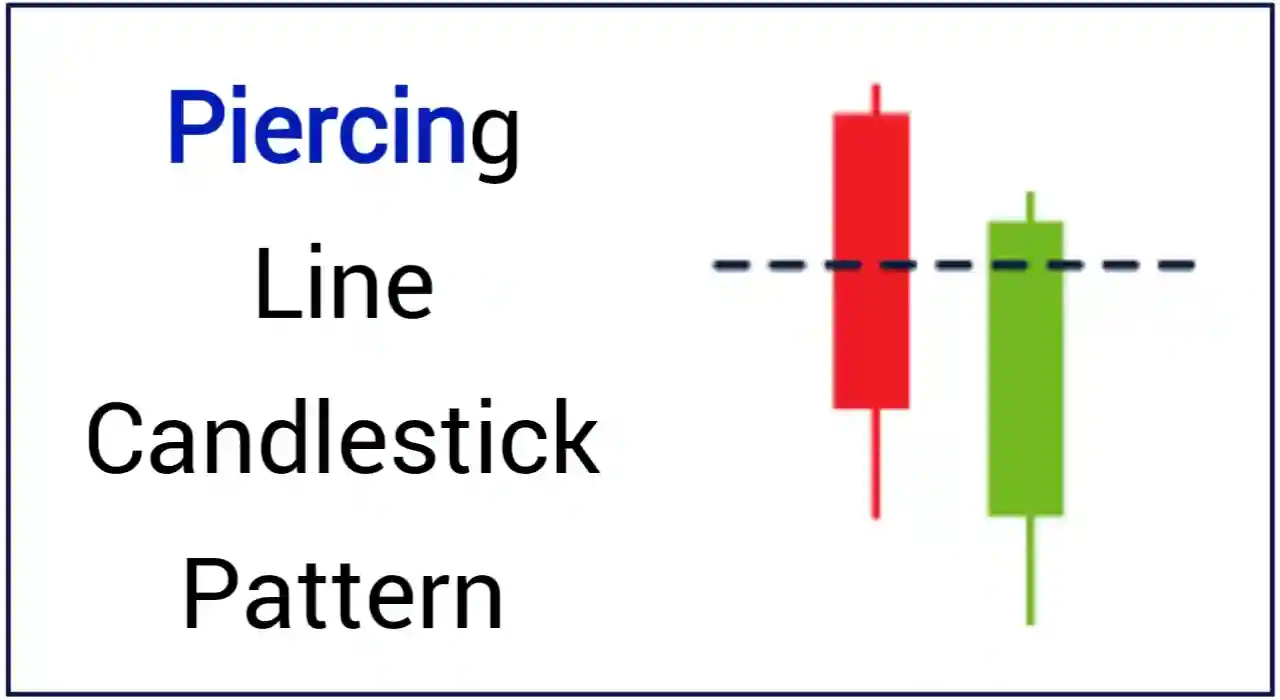
4. Piercing Line Candlestick Pattern
The “Piercing Line” is a bullish candlestick pattern that suggests a potential reversal of a downtrend. It consists of two candles:
The first candle is bearish (red or black), indicating a downward price movement.
The second candle is bullish (green or white) and opens lower than the previous day’s close but then rallies strongly, closing above the midpoint of the first candle’s body.
Example: Imagine you’re analyzing a stock chart, and you notice a red candle representing a downtrend followed by a green candle opening lower than the red one but then closing well above its midpoint.
This Piercing Line pattern suggests a potential shift from bearish to bullish sentiment.
Trading the Piercing Line Pattern:
Entry: Go long (buy) when the bullish candle of the Piercing Line pattern forms. This confirms the bullish reversal. Some traders wait for additional confirmation before entering the trade.
Stop Loss: Place a stop-loss order just below the low of the first bearish candle to protect your trade from potential losses.
Target: Set a profit target based on your risk-reward ratio, typically aiming for a reward that is at least twice the size of your risk (stop loss).
Exit: Consider exiting the trade when the price reaches your predetermined target or if you notice signs of a trend reversal or weakening bullish momentum.
Fifth Bullish Candlestick Pattern is–
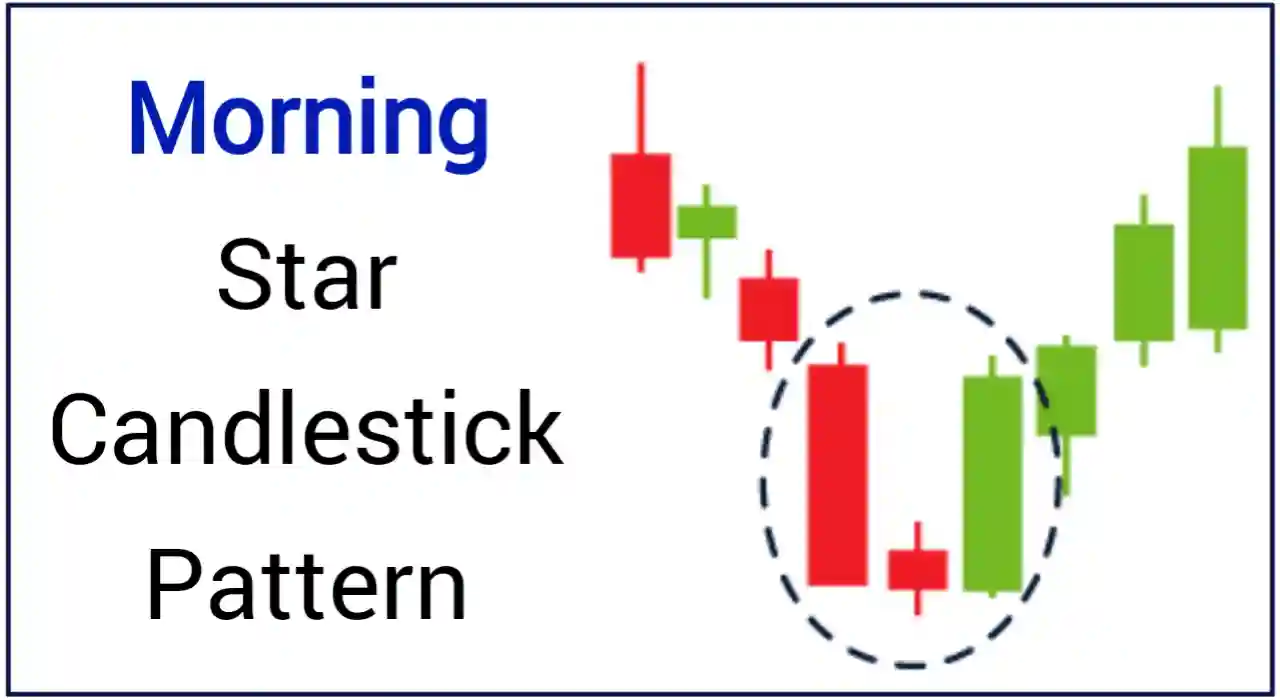
5. Morning Star Candlestick Pattern
The “Morning Star” is a strong bullish candlestick pattern that indicates a potential reversal of a downtrend. It typically appears over a three-day period and consists of three candles:
The first candle is bearish, signaling the existing downtrend.
The second candle is a small-bodied candle that can be either bullish or bearish. It signifies indecision in the market.
The third candle is a strong bullish candle that closes well above the midpoint of the first candle.
Example:
Imagine you’re analyzing a stock chart, and you see a bearish candle, followed by a small-bodied candle, and then a large bullish candle that completely engulfs the first candle’s range.
This Morning Star pattern suggests a potential shift from bearish to bullish sentiment.
How to trade Morning Star Candlestick Pattern:
Entry: Go long (buy) when the bullish candle of the Morning Star pattern forms. This confirms the bullish reversal. Some traders wait for additional confirmation before entering the trade.
Stop Loss: Place a stop-loss order just below the low of the small-bodied candle in the pattern to protect your trade from potential losses.
Target: Set a profit target based on your risk-reward ratio, typically aiming for a reward that is at least twice the size of your risk (stop loss).
Exit: Consider exiting the trade when the price reaches your predetermined target or if you notice signs of a trend reversal or weakening bullish momentum.
6. Three White Soldiers Candlestick Pattern
The “Three White Soldiers” is a robust bullish candlestick pattern that signals a potential reversal of a downtrend.
It consists of three consecutive bullish (upward) candles, each opening within the previous candle’s range and closing higher.
This pattern indicates a strong shift in sentiment from bearish to bullish.
Example:
Let’s say you’re analyzing a stock chart, and you observe three consecutive green candles, each opening higher than the previous day’s close and closing near their respective highs.
This Three White Soldiers pattern suggests a significant shift toward bullish momentum.
Trading the Three White Soldiers Pattern:
Entry: Consider entering a long (buy) position when the third candle of the Three White Soldiers pattern forms. This confirms the bullish trend. Some traders may wait for additional confirmation before entering.
Stop Loss: Place a stop-loss order below the low of the third bullish candle to limit potential losses if the trend reverses.
Target: Set a profit target based on your risk-reward ratio, aiming for a reward that is at least twice the size of your risk (stop loss).
Exit: Consider exiting the trade when the price reaches your predetermined target or if you see signs of a trend reversal or weakening bullish momentum.
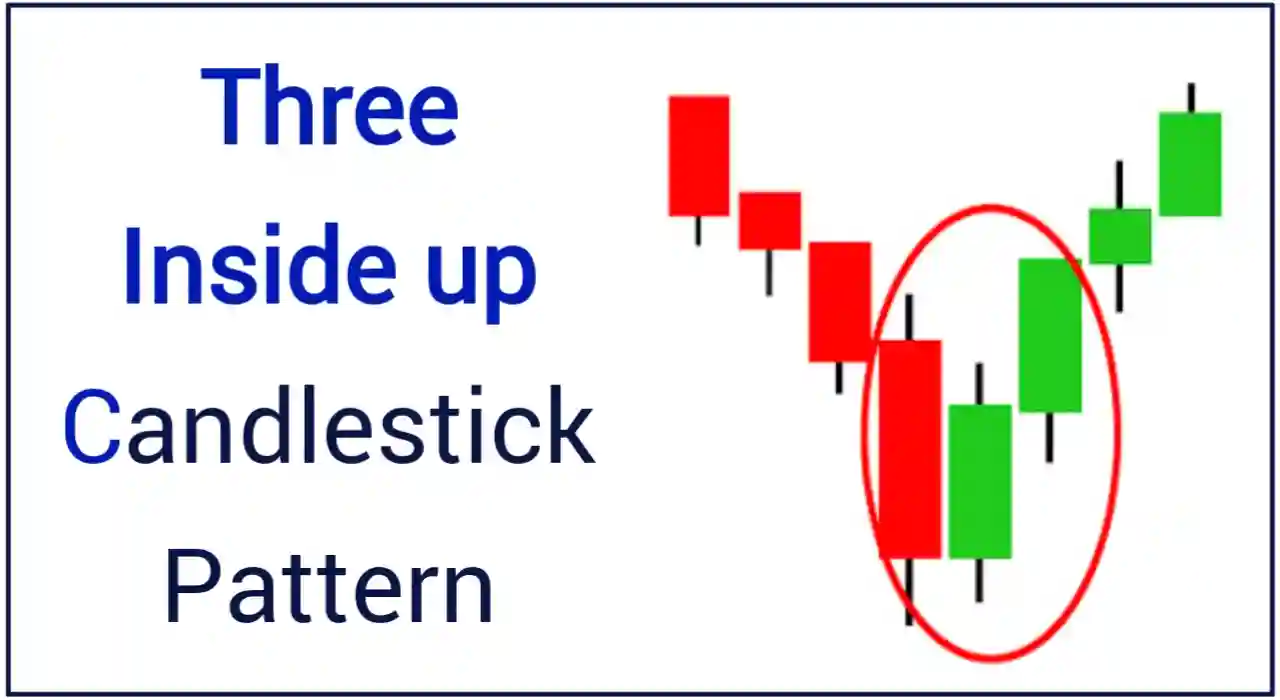
7. Three Inside Up Candlestick Pattern
The “Three Inside Up” is a bullish candlestick pattern that suggests a potential reversal of a downtrend. This pattern typically consists of three candles:
The first candle is a large bearish (downward) candle, indicating the current downtrend.
The second candle is a smaller bullish(upward) candle that is completely engulfed within the previous bearish candle’s range.
The third candle is another bullish candle that closes higher than the second candle’s close.
Example: Suppose you’re examining a stock chart, and you observe a significant red (down) candle, followed by a smaller green (up) candle entirely contained within the previous red candle’s range.
The third candle is a larger green candle that closes above the second candle’s close. This Three Inside Up pattern suggests a potential reversal from bearish to bullish.
How to trade Three Inside Up Pattern:
Entry: Consider entering a long (buy) position when the third candle of the Three Inside Up pattern forms. This confirms the bullish reversal. Some traders may wait for additional confirmation before entering.
Stop Loss: Place a stop-loss order below the low of the second (engulfed) candle to protect your trade from potential losses.
Target: Set a profit target based on your risk-reward ratio, aiming for a reward that is at least twice the size of your risk (stop loss).
Exit: Consider exiting the trade when the price reaches your predetermined target or if you see signs of a trend reversal or weakening bullish momentum.
Next bullish candlestick pattern is–
8. Dragonfly Doji Candlestick Pattern
The “Dragonfly Doji” is a bullish candlestick pattern that indicates a potential reversal of a downtrend.
It forms when the opening and closing prices are at or near the high of the trading session, and there is a long lower shadow extending below the body of the candle.
This long lower shadow shows that sellers tried to push prices lower but failed, and buyers took control.
Example:
Imagine you’re looking at a stock chart, and you see a candlestick with a small body near the top of its trading range and a long lower shadow below the body.
This Dragonfly Doji suggests that buyers have become active after a downtrend, potentially signaling a bullish reversal.
How to trade Dragonfly Doji Candlestick Pattern:
Entry: Consider entering a long (buy) position when you see a Dragonfly Doji form after a downtrend. This indicates potential bullish sentiment. Some traders may wait for confirmation before entering.
Stop Loss: Place a stop-loss order just below the low of the Dragonfly Doji’s lower shadow to protect your trade from potential losses.
Target: Set a profit target based on your risk-reward ratio, aiming for a reward that is at least twice the size of your risk (stop loss).
Exit: Consider exiting the trade when the price reaches your predetermined target or if you observe signs of a trend reversal or weakening bullish momentum.
9. Bullish Harami Candlestick Pattern
The “Bullish Harami” is a bullish candlestick pattern that suggests a potential reversal of a downtrend. It consists of two candles:
The first candle is a large bearish (downward) candle, indicating the current downtrend.
The second candle is a smaller bullish (upward) candle that is entirely contained within the previous bearish candle’s range.
Example:
Suppose you’re examining a stock chart, and you observe a substantial red (down) candle followed by a smaller green (up) candle entirely enclosed within the previous red candle’s range.
This Bullish Harami pattern suggests a potential shift from bearish to bullish sentiment.
Trading the Bullish Harami Pattern:
Entry: Consider entering a long (buy) position when the second candle of the Bullish Harami pattern forms. This confirms the bullish reversal. Some traders may wait for additional confirmation before entering.
Stop Loss: Place a stop-loss order below the low of the second (smaller) candle to protect your trade from potential losses.
Target: Set a profit target based on your risk-reward ratio, typically aiming for a reward that is at least twice the size of your risk (stop loss).
Exit: Consider exiting the trade when the price reaches your predetermined target or if you see signs of a trend reversal or weakening bullish momentum.
The Last bullish candlestick pattern is;
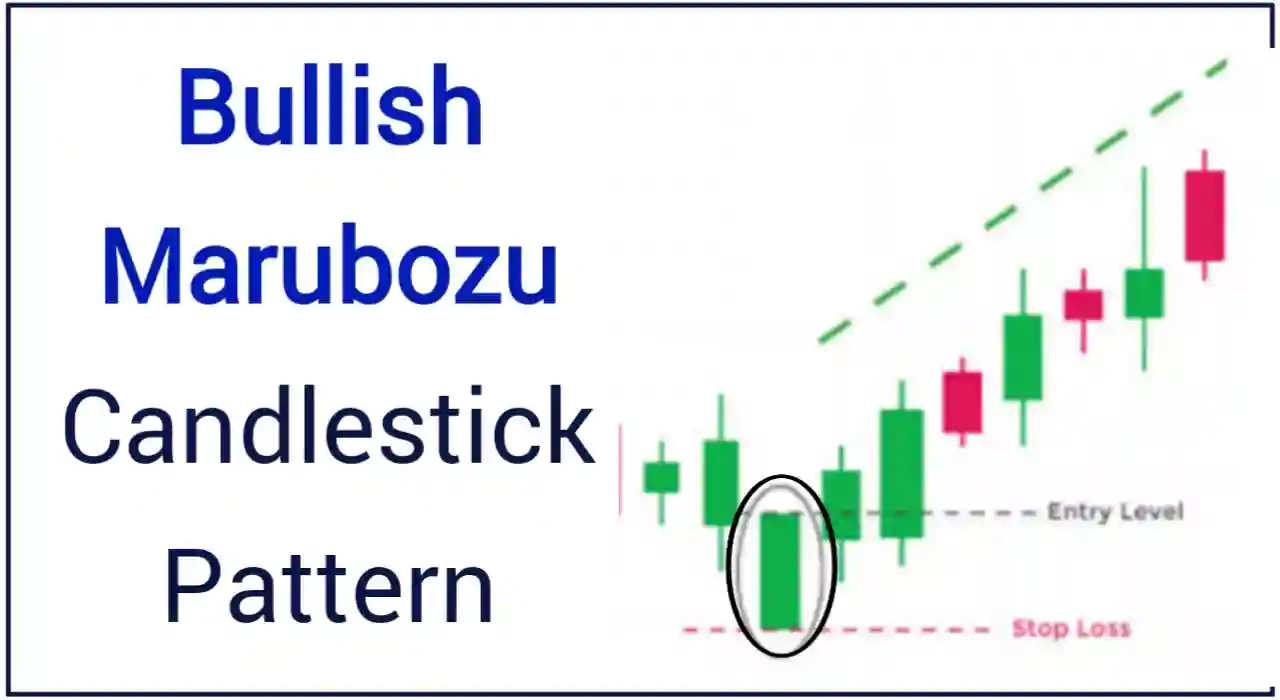
10. Bullish Marubozu Candlestick Pattern
The “Bullish Marubozu” is a powerful bullish candlestick pattern that signifies strong buying pressure throughout an entire trading session. It’s characterized by a single candle with the following traits:
The candle has no or an extremely small shadow (wick) at both the top and bottom.
The opening price is near the low, and the closing price is near the high of the session.
Example:
Imagine you’re analyzing a stock chart, and you see a candle with no visible upper or lower shadows.
The opening price is close to the low of the session, and the closing price is near the high.
This Bullish Marubozu suggests a strong and decisive shift in favor of the buyers.
Trading the Bullish Marubozu Pattern:
Entry: Consider entering a long (buy) position as soon as you observe the Bullish Marubozu pattern. It indicates a powerful bullish sentiment, and some traders may want to act quickly to capture potential gains.
Stop Loss: Place a stop-loss order just below the low of the Bullish Marubozu candle to protect your trade from potential losses if the trend reverses.
Target: Set a profit target based on your risk-reward ratio, aiming for a reward that is at least twice the size of your risk (stop loss).
Exit: Consider exiting the trade when the price reaches your predetermined target or if you notice signs of a trend reversal or weakening bullish momentum.
Risk management remains critical when trading the Bullish Marubozu pattern. Adjust your stop loss and target based on your risk tolerance and market conditions.
Additionally, use other technical or fundamental analysis tools to confirm your trading decisions.
While the Bullish Marubozu is a strong bullish signal, no pattern guarantees success in trading. Maintain discipline, stick to your trading plan, and avoid relying solely on any single indicator or pattern for trading decisions.
So These were 10 most popular Bullish Candlestick Patterns. You can make money by trading all these chart patterns.
List of Bullish Candlestick Patterns Names
Sr. No.
Bullish Pattern Name
1.
Hammer Candlestick Pattern
2.
Inverted Hammer Candlestick Pattern
3.
Bullish Engulfing Candlestick Pattern
4.
Piercing Line Candlestick Pattern
5.
Morning Star Candlestick Pattern
6.
Three White Soldiers Candlestick Pattern
7.
Three Inside Up Candlestick Pattern
8.
Dragonfly Doji Candlestick Pattern
9.
Bullish Harami Candlestick Pattern
10.
Bullish Marubozu Candlestick Pattern
So This is the List of All Bullish Candlestick Patterns.
When you will do trading and stock market then you will see these patterns are forming everyday on charts.
And you can trade these Japanese bullish candlestick patterns by following above guide that I provide you.
You can also download the PDF guide of all these bullish candlestick patterns absolutely free.
Now let’s know about how to download bullish candlestick patterns pdf for free–
How to download bullish candlestick patterns pdf?
Here are some basic steps to download bullish candlestick patterns PDF Free–
First of all click on this link to download bullish candlestick patterns PDF.
After clicking on the link you will be redirect to the Google drive page.
On this page you can read the PDF cheat sheet about bullish candlestick patterns.
To download bullish candlestick chart patterns in PDF, you can see the download icon in the top right corner so click on that download icon.
After clicking, your bullish candlestick pattern PDF will be downloaded absolutely free.
I hope now you know that how to download free bullish candlestick patterns cheat sheet PDF.
Bullish Candlestick Patterns PDF Free Download – FAQ’s
How much bullish candlestick patterns available in this Pdf?
There are total 10 bullish candlestick chart patterns available in this PDF that you can download free. By learning these all candlestick patterns you can make daily profits in the stock market.
Are all candlestick patterns free to download in this cheat sheet PDF?
Yes, all bullish candlestick chart patterns are free to download in this cheat sheet PDF.
What is the best bullish candlestick pattern?
Hammer and inverted hammer are the best bullish candlestick patterns in stock market that gives huge profits to traders. They are also some good bullish candlestick patterns like; Morning star, Bullish engulfing, Piercing Line, Bullish Harami, Three white soldiers etc.
What is the most common bullish pattern?
The most common bullish candlestick patterns are hammer, inverted hammer, Morning star, Bullish engulfing, Piercing Line and Bullish Harami. You will see all these bullish patterns daily forming on charts.
What is a bullish candlestick strategy?
The best bullish candlestick strategy is to buy below and sell above. It means you have to buy a stock on the bottom and sell it when it goes up. You can easily implement this strategy by trading bullish candlestick patterns.
Free Candlestick Patterns PDF Download ‘Conclusion’
In this post (Bullish Candlestick Patterns PDF Free Download) we have explained 10 types of Bullish Candlestick Patterns with examples.
We have also told you how to trade all these Candlestick Patterns like; where you can take entry, where to set stop loss and target and we have to exit.
All these things we have explained in each bullish pattern we mentioned in this post.
So if you are a beginner in trading then I hope this post will be very useful for you.
If you have any question related trading or any candlestick patterns then you can ask me in the comment section below.


")
")
")
 बुलिश कैंडलस्टिक पेटर्न | Bullish Candlestick Pattern in Hindi")