Top 10 Best candlestick patterns for intraday trading, Nifty and BankNifty candlestick pattern for Intraday trading, intraday candlestick chart patterns for beginners
If you’re into intraday trading, understanding candlestick patterns is a game-changer.
In this article, we tell you about 10 best Intraday candlestick patterns by using these patterns intraday traders can make daily profits.
These patterns help you make quick decisions during a single trading day, whether it’s to buy or sell. Learn these patterns to improve your intraday trading skills and potentially increase your profits.
Below we given some best candlestick chart patterns that you can use while doing intraday trading.
You can use all these patterns to trade everyday on candlestick charts.
It’s not matter that whether you use this patterns for stocks or index like Nifty or Banknifty.
That means all these candlestick patterns will work same for stocks and indices (futures and options).
So here’s our list of the Best Candlestick Patterns For Intraday Trading;
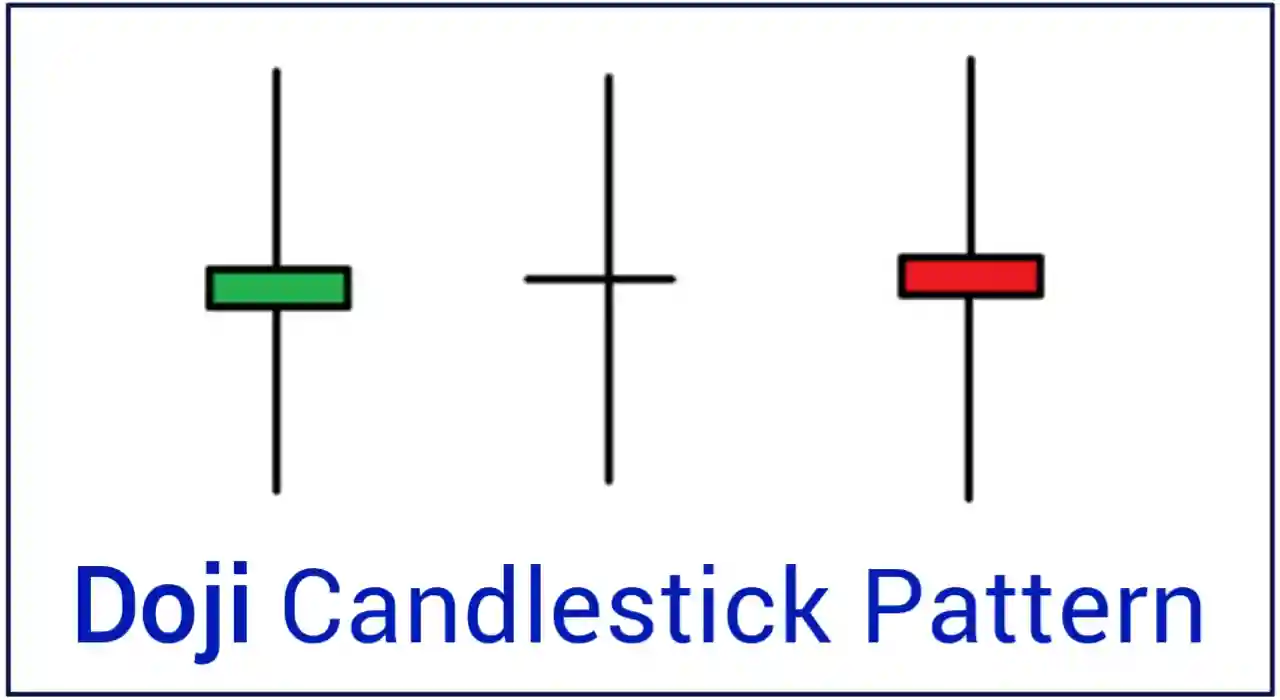
1. Doji Candlestick Pattern
Doji candlestick pattern is the best signal in intraday trading.
It happens when the opening and closing prices are very close, creating a short candle with long lines on top and bottom. This shows that the market is unsure about its direction at that moment.
Why Doji pattern is good for intraday trading:
Changing Direction: Doji can signal that the market might change direction.
Continuing the Same Way: Sometimes, it confirms that the market is staying on its current path.
Benefits:
Exact Entry/Exit: Doji helps traders find the best times to start or end a trade.
Less Risk: It can be used to set limits on how much you’re willing to lose.
How to use it:
Double-Check: Use Doji with other tools to be more sure of its signal.
When to Act: Make a trade when the price moves in the direction the Doji suggests, or get out if it changes.
For Example–
Imagine you’re doing intraday trading in the stock market, and you’re observing a 5-minute chart of a particular stock. You notice a Doji candlestick forming after a downtrend. Here’s how you might approach this trade:
1. Identification: You see a Doji candlestick on the chart, indicating market indecision.
2. Confirmation: To confirm the signal, you check other indicators like the Relative Strength Index (RSI) and Moving Averages. If they also suggest a potential reversal, it strengthens your case.
3. Entry: If the Doji appears after a downtrend and other indicators align, you might consider entering a long (buy) position. This suggests that the bears are losing strength, and a reversal might be imminent.
4. Stop-Loss: To manage risk, set a stop-loss order slightly below the low of the Doji candlestick. This helps limit potential losses if the trade goes against you.
5. Take Profit: Consider setting a take-profit order at a reasonable target level, perhaps a previous resistance point or a percentage gain you’re comfortable with.
6. Monitoring: Continuously monitor the trade. If the price starts moving in your favor, you can adjust your stop-loss to protect profits or let it run if the trend continues.
7. Exit: If the price moves significantly in the direction you anticipated, and your take-profit level is reached, or if you notice signs of a reversal, consider closing the trade.
Remember, this is a simple example, and real trading involves various factors and risks. It’s important to practice good risk management, use multiple indicators, and consider your overall trading strategy before making any trade decisions based on the Doji or any other candlestick pattern.
Now let’s move on to second pattern which is;
2. Hammer Candlestick Pattern
Hammer is one of the best candlestick pattern for Intraday trading.
It forms when the price opens, then drops significantly during the trading session, only to recover and close near or above the opening price. It resembles a hammer, with a small body and a long lower shadow.
Why hammer is best candlestick pattern for intraday trading:
Reversal Signal: Hammers often appear at potential reversal points, signaling a shift from bearish to bullish sentiment.
Quick Decisions: Intraday traders need rapid signals, and the Hammer provides clear indications in short timeframes.
How to use it with an example:
Imagine you’re trading a stock intraday, and you spot a Hammer candlestick pattern after a series of price declines. Here’s a practical approach:
1. Identification: You see a Hammer forming, indicating potential reversal.
2. Confirmation: Check other indicators like RSI or MACD for further confirmation of a reversal.
3. Entry: Consider entering a long position when the price moves above the high of the Hammer candlestick. This suggests a bullish reversal.
4. Stop-Loss: To manage risk, set a stop-loss order just below the low of the Hammer. This protects you if the trade doesn’t go as expected.
5. Take Profit: Determine a target level, such as a previous resistance point or a percentage gain, and set a take-profit order accordingly.
6. Monitoring: Continuously watch the trade. If the price moves favorably, you can adjust your stop-loss to secure profits or let it ride if the trend continues.
7. Exit: Close the trade when your take-profit level is reached or if you notice signs of a reversal.
Hammer patterns offer valuable insights, but always remember to use them as part of a broader trading strategy and with risk management in mind.
Benefits:
Entry Point: It helps traders identify entry points for buying (going long) after a downtrend.
Risk Management: Placing a stop-loss order just below the low of the Hammer can limit potential losses.
Confirmation: Combine the Hammer with other indicators, such as Moving Averages, to strengthen your trade decision.
Third candlestick pattern is;
3. Shooting Star Candlestick Pattern
Shooting Star is another best candlestick pattern for intraday trading.
It appears when a price opens, rallies significantly during the trading session, then reverses to close near or below the opening price. This pattern resembles a star with a long upper shadow and a small body.
Why shooting star pattern best for intraday trading:
Reversal Signal: Shooting Stars often indicate a potential shift from bullish to bearish sentiment, making them valuable for quick decision-making in intraday trading.
How to use it with an example:
Imagine you’re trading a stock in intraday, and you see a Shooting Star candlestick pattern after a series of price gains. Here’s a practical approach:
1. Identification: You see a Shooting Star forming, indicating a potential reversal from a bullish trend.
2. Confirmation: Verify the signal by checking other indicators like RSI or MACD.
3. Entry: Consider entering a short position when the price moves below the low of the Shooting Star. This suggests a bearish reversal.
4. Stop-Loss: To manage risk, set a stop-loss order just above the high of the Shooting Star. This safeguards you if the trade goes against you.
5. Take Profit: Determine a target level, such as a previous support point or a percentage decline, and set a take-profit order accordingly.
6. Monitoring: Continuously monitor the trade. If the price moves in your favor, you can adjust your stop-loss to secure profits or exit if the trend reverses.
7. Exit: Close the trade when your take-profit level is reached or if you observe signs of a reversal.
Shooting Star patterns offer valuable insights, but remember to use them as part of a comprehensive trading strategy and employ risk management techniques.
Benefits:
Entry Point: It helps traders spot entry points for short-selling (going short) after an uptrend.
Risk Management: Placing a stop-loss order just above the high of the Shooting Star can limit potential losses.
Confirmation: Combine the Shooting Star with other indicators, like Moving Averages, to strengthen your trading decision.
Now let’s move on to next candlestick pattern for intraday trading;
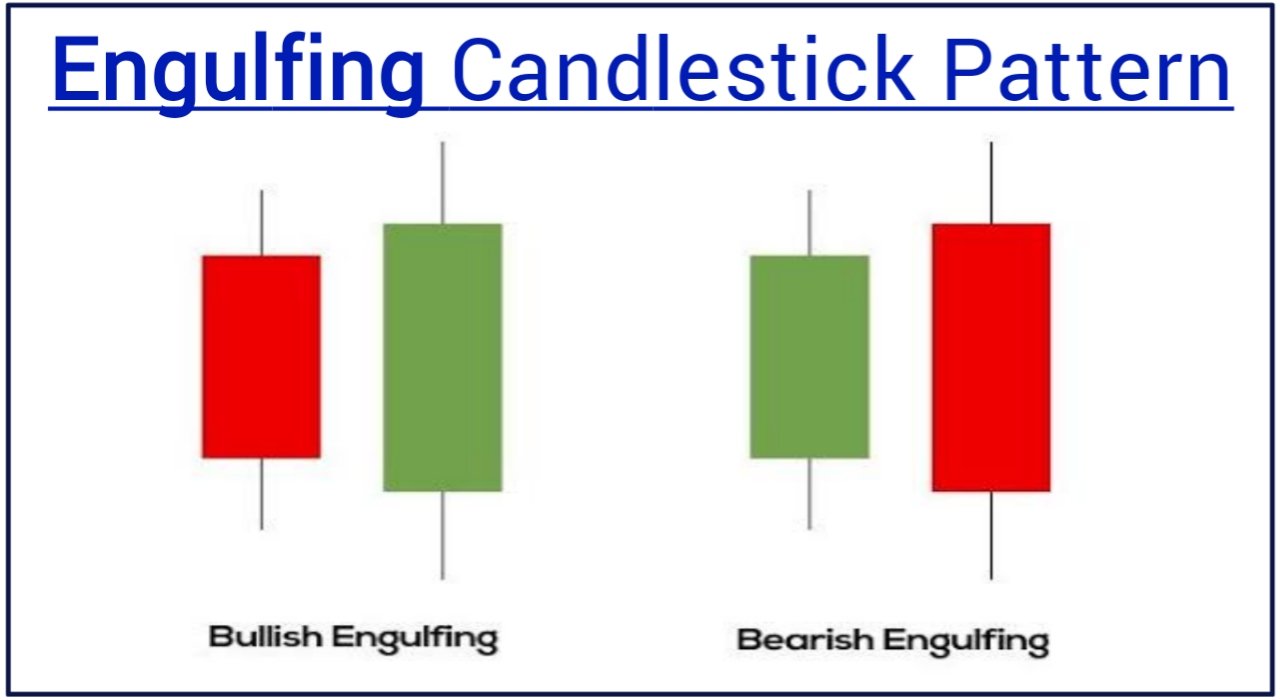
4. Engulfing Pattern Candlestick Pattern
The Engulfing Candlestick pattern is a powerful signal in intraday trading. It consists of two candles where the second one completely engulfs the first.
In a Bullish Engulfing, the second candle is larger and closes higher than the first, signaling a potential reversal from a downtrend.
Conversely, in a Bearish Engulfing, the second candle is larger and closes lower, indicating a possible reversal from an uptrend.
Why engulfing is good candlestick pattern for intraday trading:
Strong Reversal Signal: Engulfing patterns provide clear and compelling signals for quick decision-making during the trading day.
Benefits:
Entry Point: They help traders identify entry points for potential trend reversals.
Risk Management: Set a stop-loss order above (for Bearish Engulfing) or below (for Bullish Engulfing) the pattern to manage risk.
Confirmation: Combine Engulfing patterns with other indicators, like Moving Averages, to strengthen your trade decision.
How to use it with an example:
Imagine you’re trading nifty in intraday, and you see a Bearish Engulfing pattern after a series of price increases. Here’s a practical approach:
1. Identification: You see a Bearish Engulfing pattern forming, indicating a potential reversal from a bullish trend.
2. Confirmation: Check other indicators like RSI or MACD to confirm the signal.
3. Entry: Consider entering a short position when the price moves below the low of the Bearish Engulfing candle. This suggests a bearish reversal.
4. Stop-Loss: To manage risk, set a stop-loss order just above the high of the Bearish Engulfing candle. This protects you if the trade goes against you.
5. Take Profit: Determine a target level, such as a previous support point or a percentage decline, and set a take-profit order accordingly.
6. Monitoring: Continuously monitor the trade. If the price moves in your favor, you can adjust your stop-loss to secure profits or exit if the trend reverses.
7. Exit: Close the trade when your take-profit level is reached or if you observe signs of a reversal.
Engulfing patterns are beneficial for intraday traders due to their reliability, but always use them as part of a comprehensive trading strategy and practice proper risk management.
Next intraday candlestick pattern is;
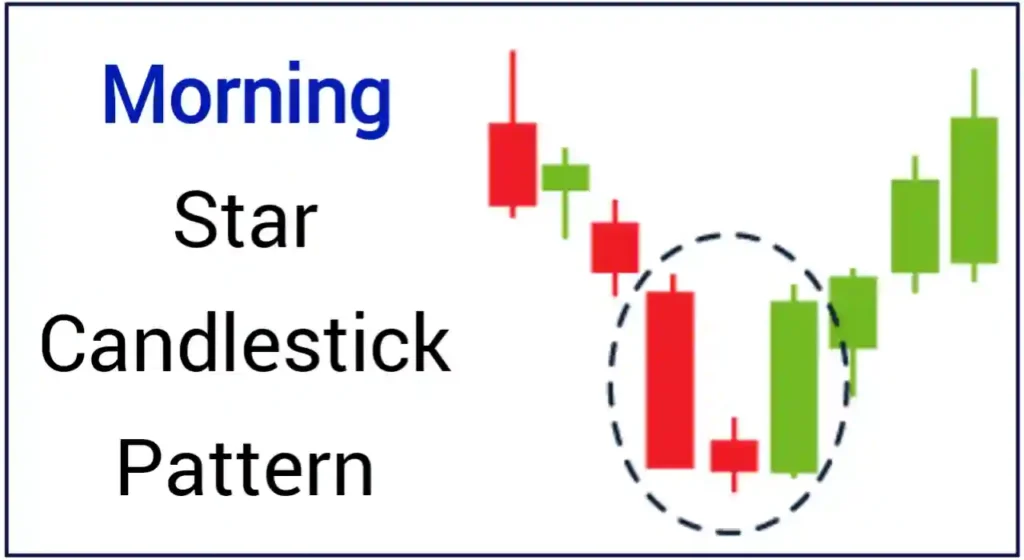
5. Morning Star Candlestick Pattern
The Morning Star candlestick pattern is a potent signal for intraday traders. It appears in a three-candle sequence.
First, a bearish candlestick signifies a downtrend.
Then, a small, indecisive candle forms, indicating market uncertainty.
Finally, a bullish candle forms, closing higher than the first candle, suggesting a potential reversal from the downtrend.
Why it’s great for intraday trading:
Strong Reversal Signal: Morning Star patterns offer a clear and reliable sign of a potential shift from bearish to bullish sentiment.
Benefits:
Entry Point: They help traders identify entry points for potential trend reversals.
Risk Management: Set a stop-loss order below the low of the Morning Star pattern to manage risk.
Confirmation: Combine the Morning Star with other indicators, like Moving Averages, to enhance your trade decision.
How to use it with an example:
Imagine you’re trading a stock intraday, and you spot a Morning Star pattern after a series of price declines. Here’s a practical approach:
1. Identification: You see a Morning Star pattern forming, indicating a potential reversal from a bearish trend.
2. Confirmation: Verify the signal by checking other indicators like RSI or MACD.
3. Entry: Consider entering a long position when the price moves above the high of the bullish candle in the Morning Star pattern. This suggests a bullish reversal.
4. Stop-Loss: To manage risk, set a stop-loss order just below the low of the bullish candle in the Morning Star pattern. This safeguards you if the trade goes against you.
5. Take Profit: Determine a target level, such as a previous resistance point or a percentage gain, and set a take-profit order accordingly.
6. Monitoring: Continuously monitor the trade. If the price moves favorably, you can adjust your stop-loss to secure profits or exit if the trend reverses.
7. Exit: Close the trade when your take-profit level is reached or if you observe signs of a reversal.
Next pattern is;
6. Evening Star Candlestick Pattern
The Evening Star candlestick pattern is a vital tool for intraday traders. It unfolds in three candles.
First, a bullish candle indicates an uptrend.
Then, a small, indecisive candle forms, showing uncertainty.
Finally, a bearish candle closes lower than the first, signaling a potential reversal from the uptrend.
Why it’s great for intraday trading:
Strong Reversal Signal: Evening Star patterns provide a clear and robust indication of a possible shift from bullish to bearish sentiment.
Benefits:
Entry Point: They help traders spot entry points for potential trend reversals.
Risk Management: Set a stop-loss order above the high of the Evening Star pattern to manage risk. Confirmation: Combine the Evening
Star with other indicators, such as Moving Averages, to enhance your trade decision.
How to use it with an example:
Imagine you’re trading a currency pair intraday, and you spot an Evening Star pattern after a series of price gains. Here’s a practical approach:
1. Identification: You see an Evening Star pattern forming, indicating a potential reversal from a bullish trend.
2. Confirmation: Verify the signal by checking other indicators like RSI or MACD.
3. Entry: Consider entering a short position when the price moves below the low of the bearish candle in the Evening Star pattern. This suggests a bearish reversal.
4. Stop-Loss: To manage risk, set a stop-loss order just above the high of the bearish candle in the Evening Star pattern. This safeguards you if the trade goes against you.
5. Take Profit: Determine a target level, such as a previous support point or a percentage decline, and set a take-profit order accordingly.
6. Monitoring: Continuously watch the trade. If the price moves favorably, you can adjust your stop-loss to secure profits or exit if the trend reverses.
7. Exit: Close the trade when your take-profit level is reached or if you observe signs of a reversal.
Morning Star and Evening Star patterns are valuable for intraday traders due to their reliability, but always use them as part of a comprehensive trading strategy and practice proper risk management.
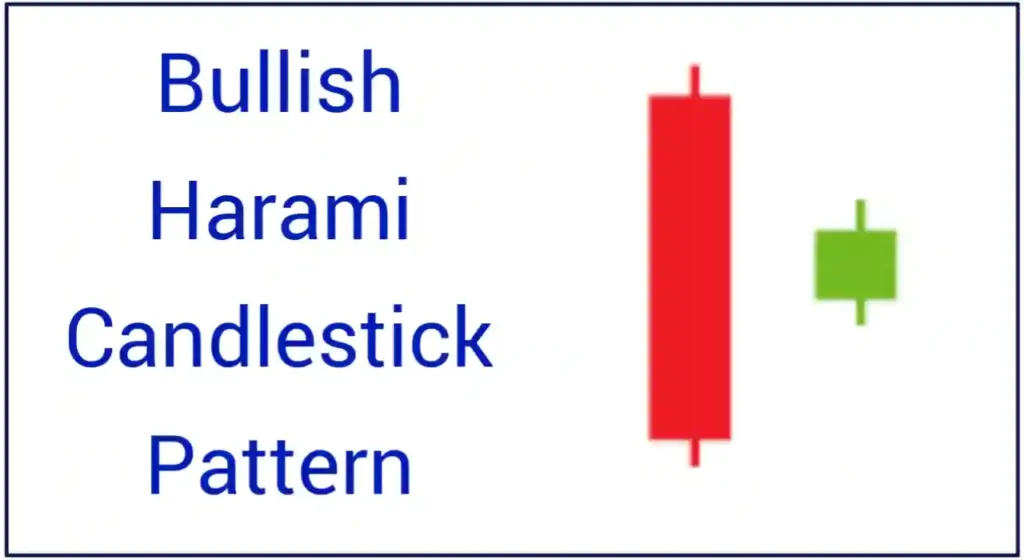
7. Bullish Harami Candlestick Pattern
The Bullish Harami candlestick pattern is a crucial tool for intraday traders. It consists of two candles.
The first is a large bearish candle, indicating a downtrend.
The second is a smaller bullish candle, entirely enclosed within the previous bearish candle’s range.
This pattern signals a potential reversal from a bearish to a bullish trend.
Why it’s great for intraday trading:
Strong Reversal Signal: Bullish Harami provides a clear and strong indication of a potential shift from bearish to bullish sentiment within a short timeframe.
Benefits:
Entry Point: It helps traders identify entry points for potential trend reversals.
Risk Management: Set a stop-loss order below the low of the bullish candle in the Bullish Harami to manage risk.
Confirmation: Combine Bullish Harami with other indicators, like Moving Averages, to enhance your trade decision.
How to use Bullish Harami pattern:
Imagine you’re trading a stock intraday, and you spot a Bullish Harami pattern after a series of price declines. Here’s a practical approach:
1. Identification: You see a Bullish Harami forming, indicating a potential reversal from a bearish trend.
2. Confirmation: Verify the signal by checking other indicators like RSI or MACD.
3. Entry: Consider entering a long position when the price moves above the high of the bullish candle in the Bullish Harami pattern. This suggests a bullish reversal.
4. Stop-Loss: To manage risk, set a stop-loss order just below the low of the bullish candle in the Bullish Harami. This safeguards you if the trade goes against you.
5. Take Profit: Determine a target level, such as a previous resistance point or a percentage gain, and set a take-profit order accordingly.
6. Monitoring: Continuously monitor the trade. If the price moves favorably, you can adjust your stop-loss to secure profits or exit if the trend reverses.
7. Exit: Close the trade when your take-profit level is reached or if you observe signs of a reversal.
Next pattern is;
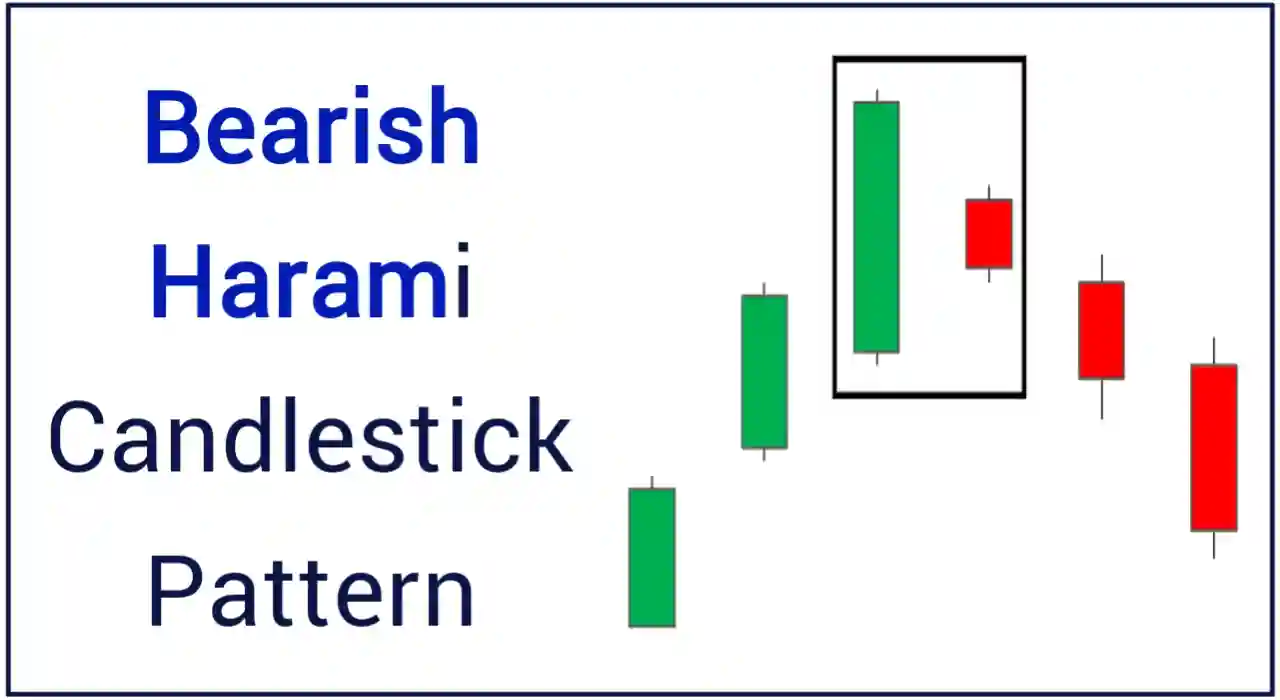
8. Bearish Harami Candlestick Pattern
The Bearish Harami candlestick pattern is a crucial tool for intraday traders. It consists of two candles.
The first is a large bullish candle, indicating an uptrend.
The second is a smaller bearish candle, entirely enclosed within the previous bullish candle’s range.
This pattern signals a potential reversal from a bullish to a bearish trend.
Why it’s great for intraday trading:
Strong Reversal Signal: Bearish Harami provides a clear and robust indication of a potential shift from bullish to bearish sentiment within a short timeframe.
Benefits:
Entry Point: It helps traders identify entry points for potential trend reversals.
Risk Management: Set a stop-loss order above the high of the bearish candle in the Bearish Harami to manage risk.
Confirmation: Combine Bearish Harami with other indicators, like Moving Averages, to enhance your trade decision.
How to use Bearish Harami pattern:
Imagine you’re trading a stock in intraday, and you spot a Bearish Harami pattern after a series of price increases. Here’s a practical approach for trading:
1. Identification: You see a Bearish Harami forming, indicating a potential reversal from a bullish trend.
2. Confirmation: Verify the signal by checking other indicators like RSI or MACD.
3. Entry: Consider entering a short position when the price moves below the low of the bearish candle in the Bearish Harami pattern. This suggests a bearish reversal.
4. Stop-Loss: To manage risk, set a stop-loss order just above the high of the bearish candle in the Bearish Harami. This safeguards you if the trade goes against you.
5. Take Profit: Determine a target level, such as a previous support point or a percentage decline, and set a take-profit order accordingly.
6. Monitoring: Continuously monitor the trade. If the price moves favorably, you can adjust your stop-loss to secure profits or exit if the trend reverses.
7. Exit: Close the trade when your take-profit level is reached or if you observe signs of a reversal.
Bullish Harami and Bearish Harami candlestick patterns are valuable for intraday traders due to their reliability, but always use them as part of a comprehensive trading strategy and practice proper risk management.
9. Three White Soldiers Candlestick Pattern
The Three White Soldiers candlestick pattern is a strong signal for intraday traders.
It comprises three consecutive bullish candles, each closing higher than the previous one.
This pattern signifies a strong uptrend and a potential continuation of bullish momentum.
Why it’s great for intraday trading:
Strong Trend Signal: Three White Soldiers provide a clear indication of a strong uptrend, making it valuable for intraday traders seeking to ride the trend.
Benefits:
Entry Point: It helps traders identify entry points for trading alongside a confirmed bullish trend.
Trend Confirmation: The pattern confirms the ongoing strength of the uptrend, offering confidence to traders.
Risk Management: Set a stop-loss order below the recent swing low to manage risk effectively.
How to use it with an example:
Imagine you’re trading a stock intraday, and you spot the Three White Soldiers pattern after some price consolidation. Here’s a practical approach:
1. Identification: You see Three White Soldiers forming, indicating a strong uptrend.
2. Confirmation: Verify the pattern by checking other indicators like the Relative Strength Index (RSI) or Moving Averages.
3. Entry: Consider entering a long position when the price confirms the Three White Soldiers pattern by moving higher. This suggests a continuation of the bullish trend.
4. Stop-Loss: To manage risk, set a stop-loss order just below the recent swing low. This protects you if the trade goes against you.
5. Take Profit: Determine a target level, such as a resistance point or a percentage gain, and set a take-profit order accordingly.
6. Monitoring: Continuously watch the trade. If the price moves in your favor, you can adjust your stop-loss to secure profits or exit if the trend weakens.
7. Exit: Close the trade when your take-profit level is reached or if you observe signs of a trend reversal.
The Three White Soldiers pattern is beneficial for intraday traders because of its strong trend confirmation, but always use it as part of a comprehensive trading strategy and employ risk management techniques.
Last candlestick pattern for intraday trading is;
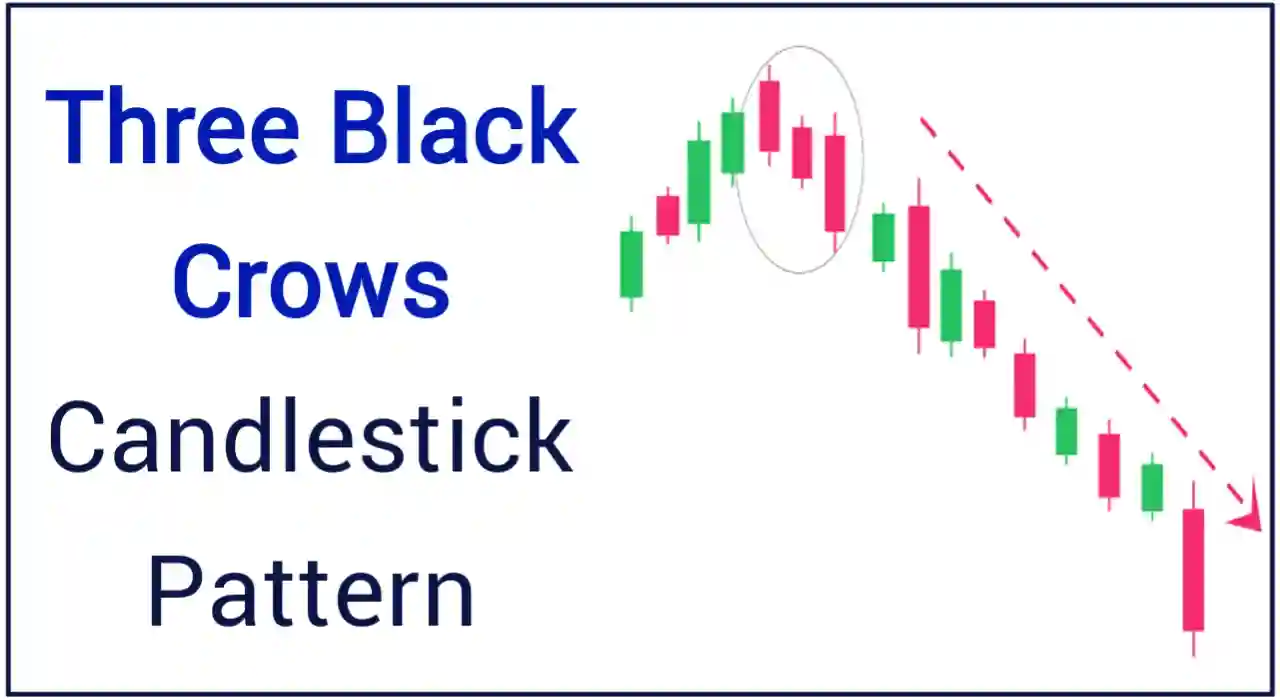
10. Three Black Crows Candlestick Pattern
The Three Black Crows candlestick pattern is a important signal for intraday traders.
It consists of three consecutive bearish candles, each closing lower than the previous one, suggesting a strong downtrend and potential continuation of bearish momentum.
Why it’s good for intraday trading:
Strong Trend Signal: Three Black Crows provide a clear and robust indication of a strong downtrend, making it valuable for intraday traders looking to profit from falling prices.
Benefits:
Entry Point: It helps traders identify entry points for trading alongside a confirmed bearish trend.
Trend Confirmation: The pattern confirms the ongoing strength of the downtrend, offering confidence to traders.
Risk Management: Set a stop-loss order above the recent swing high to manage risk effectively.
How to use it with an example:
Imagine you’re trading a currency pair intraday, and you spot the Three Black Crows pattern after a period of price consolidation. Here’s a practical approach:
1. Identification: You see Three Black Crows forming, indicating a strong downtrend.
2. Confirmation: Verify the pattern by checking other indicators like the Relative Strength Index (RSI) or Moving Averages.
3. Entry: Consider entering a short position when the price confirms the Three Black Crows pattern by moving lower. This suggests a continuation of the bearish trend.
4. Stop-Loss: To manage risk, set a stop-loss order just above the recent swing high. This protects you if the trade goes against you.
5. Take Profit: Determine a target level, such as a support point or a percentage decline, and set a take-profit order accordingly.
6. Monitoring: Continuously watch the trade. If the price moves in your favor, you can adjust your stop-loss to secure profits or exit if the trend weakens.
7. Exit: Close the trade when your take-profit level is reached or if you observe signs of a trend reversal.
The Three Black Crows pattern is beneficial for intraday traders due to its strong trend confirmation, but always use it as part of a comprehensive trading strategy and employ risk management techniques.
So These were 10 most popular Bearish Candlestick Patterns. You can make money by trading all these chart patterns.
List of Intraday Candlestick Patterns Names
Sr. No.
Intraday Candlestick Pattern Name
1.
Doji Candlestick Pattern
2.
Hammer Candlestick Pattern
3.
Shooting Star Candlestick Pattern
4.
Engulfing Candlestick Pattern
5.
Morning Star Candlestick Pattern
6.
Evening Star Candlestick Pattern
7.
Bullish Harami Candlestick Pattern
8.
Bearish Harami Candlestick Pattern
9.
Three White Sholdiers Candlestick Pattern
10.
Three Black Crows Candlestick Pattern Candlestick Pattern
So This is the List of All Bearish Candlestick Patterns.
Which candlestick pattern is best for intraday trading?
Hammer, Shooting star, Engulfing and harami are the best candlestick patterns for Intraday trading. Intraday traders can also use morning star and evening star pattern to make daily profits.
What is a candlestick pattern in intraday trading, and why are they important?
A candlestick pattern is a visual representation of how a stock’s price moved during a specific time. They’re important because they help traders predict future price movements based on past patterns.
Which candlestick pattern is best for spotting trend reversals during intraday trading?
The “Hammer” and “Shooting Star” patterns are good for spotting trend reversals. A Hammer suggests a bullish reversal, while a Shooting Star hints at a bearish reversal.
How can I effectively use these candlestick patterns in my intraday trading strategy?
Learn to recognize patterns and use them alongside other indicators for confirmation. For example, use Moving Averages or RSI to support your decisions.
What are some common mistakes to avoid when interpreting candlestick patterns for intraday trading?
Avoid overtrading and relying solely on candlestick patterns. It’s crucial to consider the bigger picture and use risk management strategies.
Are there any recommended tools or software for identifying candlestick patterns in real-time during intraday trading?
Yes, there are various trading platforms and charting software that can help you identify candlestick patterns in real-time. Some popular options include MetaTrader, TradingView, and Thinkorswim.
Candlestick patterns for intraday trading– ‘Conclusion’
Mastering these top 10 candlestick patterns is a smart move for intraday traders.
These patterns give you clear signals for making quick decisions. Whether it’s a Doji or Three Black Crows, they help you understand what might happen next.
Use these patterns wisely, manage your risks, and you’ll be better prepared to succeed in intraday trading, potentially boosting your profits.


")
")
")
")